How (noun.)
Definition: The specific ways something will be made or delivered.
Also referenced as:
Chapter 1: Identify the Mess | Page 12
It’s hard to shine a light on the messes we face.
It’s hard to be the one to say that something is a mess. Like a little kid standing at the edge of a dark room, we can be paralyzed by fear and not even know how to approach the mess.
These are the moments where confusion, procrastination, self-criticism, and frustration keep us from changing the world.
The first step to taming any mess is to shine a light on it so you can outline its edges and depths.
Once you brighten up your workspace, you can guide yourself through the complex journey of making sense of the mess.
I wrote this simple guidebook to help even the least experienced sensemakers tame the messes made of information (and people!) they’re sure to encounter.
Chapter 1: Identify the Mess | Page 15
Things may change; the messes stay the same.
We’ve been learning how to architect information since the dawn of thought.
Page numbering, alphabetical order, indexes, lexicons, maps, and diagrams are all examples of information architecture achievements that happened well before the information age.
Even now, technology continues to change the things we make and use at a rate we don’t understand yet. But when it really comes down to it, there aren’t that many causes for confusing information.
- Too much information
- Not enough information
- Not the right information
- Some combination of these (eek!)
Chapter 1: Identify the Mess | Page 17
Every thing is complex.
Some things are simple. Some things are complicated. Every single thing in the universe is complex.
Complexity is part of the equation. We don’t get to choose our way out of it.
Here are three complexities you may encounter:
- A common complexity is lacking a clear direction or agreeing on how to approach something you are working on with others.
- It can be complex to create, change, access, and maintain useful connections between people and systems, but these connections make it possible for us to communicate.
- People perceive what’s going on around them in different ways. Differing interpretations can make a mess complex to work through.
Chapter 1: Identify the Mess | Page 20
What’s information?
Information is not a fad. It wasn’t even invented in the information age. As a concept, information is old as language and collaboration is.
The most important thing I can teach you about information is that it isn’t a thing. It’s subjective, not objective. It’s whatever a user interprets from the arrangement or sequence of things they encounter.
For example, imagine you’re looking into a bakery case. There’s one plate overflowing with oatmeal raisin cookies and another plate with a single double-chocolate chip cookie. Would you bet me a cookie that there used to be more double-chocolate chip cookies on that plate? Most people would take me up on this bet. Why? Because everything they already know tells them that there were probably more cookies on that plate.
The belief or non-belief that there were other cookies on that plate is the information each viewer interprets from the way the cookies were arranged. When we rearrange the cookies with the intent to change how people interpret them, we’re architecting information.
While we can arrange things with the intent to communicate certain information, we can’t actually make information. Our users do that for us.
Chapter 1: Identify the Mess | Page 23
Information is architected to serve different needs.
If you rip out the content from your favorite book and throw the words on the floor, the resulting pile is not your favorite book.
If you define each word from your favorite book and organize the definitions alphabetically, you would have a dictionary, not your favorite book.
If you arrange each word from your favorite book by gathering similarly defined words, you have a thesaurus, not your favorite book.
Neither the dictionary nor the thesaurus is anything like your favorite book, because both the architecture and the content determine how you interpret and use the resulting information.
For example, “8 of 10 Doctors Do Not Recommend” and “Doctor Recommended” are both true statements, but each serves a different intent.
Chapter 1: Identify the Mess | Page 24
Users are complex.
User is another word for a person. But when we use that word to describe someone else, we’re likely implying that they’re using the thing we’re making. It could be a website, a product or service, a grocery store, a museum exhibit, or anything else people interact with.
When it comes to our use and interpretation of things, people are complex creatures.
We’re full of contradictions. We’re known to exhibit strange behaviors. From how we use mobile phones to how we traverse grocery stores, none of us are exactly the same. We don’t know why we do what we do. We don’t really know why we like what we like, but we do know it when we see it. We’re fickle.
We expect things to be digital, but also, in many cases, physical. We want things to feel auto-magic while retaining a human touch. We want to be safe, but not spied on. We use words at our whim.
Most importantly perhaps, we realize that for the first time ever, we have easy access to other people’s experiences to help us decide if something is worth experiencing at all.
Chapter 1: Identify the Mess | Page 27
Meet Carl.
Carl is a design student getting ready to graduate. But first, he has to produce a book explaining his design work and deliver a ten-minute presentation.
While Carl is a talented designer, public speaking makes him queasy and he doesn’t consider himself much of a writer. He has drawers and boxes full of notes, scribbles, sketches, magazine clippings, quotes, and prototypes.
Carl has the pieces he needs to make his book and presentation come to life. He also has a momentum-killing fear of the mess he’s facing.
To help Carl identify his mess, we could start by asking questions about its edges and depths:
- Who are his users and what does he know about them already? How could he find out more?
- Who are the stakeholders and what does he know about what they are expecting?
- How does he want people to interpret the work? What content would help that interpretation?
- What might distract from that interpretation?
Chapter 1: Identify the Mess | Page 28
It’s your turn.
This chapter outlines why it’s important to identify the edges and depths of a mess, so you can lessen your anxiety and make progress.
I also introduced the need to look further than what is true, and pay attention to how users and stakeholders interpretlanguage, data, and content.
To start to identify the mess you’re facing, work through these questions:
- Users: Who are your intended users? What do you know about them? How can you get to know them better? How might they describe this mess?
- Stakeholders: Who are your stakeholders? What are their expectations? What are their thoughts about this mess? How might they describe it?
- Information: What interpretations are you dealing with? What information is being created through a lack of data or content?
- Current state: Are you dealing with too much information, not enough information, not the right information, or a combination of these?
Chapter 2: State your Intent | Page 32
Intent is language.
Intent is the effect we want to have on something. We make language-based decisions whenever we talk about our intent.
Our language choices change how we use our time and energy. For every word we use to describe where we want to go, there’s another word that we’re walking away from.
For every amusement park you make, you’re not making a video game. When you intend to be fun for kids, you can use stories but not metaphors. If you want something to be relaxing, it’s harder to make it educational.
The words we choose matter. They represent the ideas we want to bring into the world.
We need words so we can make plans. We need words to turn ideas into things.
For example, if we say that we want to make sustainable eco-centered design solutions, we can’t rely on thick, glossy paper catalogs to help us reach new customers. By choosing those words, we completely changed our options.
Chapter 2: State your Intent | Page 33
What is good?
Language is any system of communication that exists to establish shared meaning. Even within a single language, one term can mean something in situation A and something different in situation B. We call this a homograph. For example, the word pool can mean a swimming pool, shooting pool, or a betting pool.
Perception is the process of considering, and interpreting something. Perception is subjective like truth is. Something that’s beautiful to one person may be an eyesore to another. For example, many designers would describe the busy, colorful patterns in the carpets of Las Vegas as gaudy. People who frequent casinos often describe them as beautiful.
However good or bad these carpet choices seem to us, there are reasons why they look that way. Las Vegas carpets are busy and colorful to disguise spills and wear and tear from foot traffic. Gamblers likely enjoy how they look because of an association with an activity that they enjoy. For Las Vegas casino owners and their customers, those carpet designs are good. For designers, they’re bad. Neither side is right. Both sides have an opinion.
What we intend to do determines how we define words like good and bad.
Chapter 2: State your Intent | Page 35
Looking good versus being good.
Pretty things can be useless, and ugly things can be useful. Beauty and quality are not always related.
When making things, we should aim to give equal attention to looking good and being good. If either side of that duality fails, the whole suffers.
As users, we may assume that a good-looking thing will also be useful and well thought-out. But it only takes a minute or two to see if our assumptions are correct. If it isn’t good, we’ll know.
As sensemakers, we may fall victim to these same assumptions about the relationships between beauty and quality of thought.
Beware of pretty things. Pretty things can lie and hide from reality. Ugly things can too.
If we’re going to sort out the messes around us, we need to ask difficult questions and go deeper than how something looks to determine if it’s good or not.
Chapter 2: State your Intent | Page 37
Meaning can get lost in translation.
Did you ever play the telephone game as a child?
It consists of a group of kids passing a phrase down the line in a whisper. The point of the game is to see how messed up the meaning of the initial message becomes when sent across a messy human network.
Meaning can get lost in subtle ways. It’s wrapped up in perception, so it’s also subjective. Most misunderstandings stem from mixed up meanings and miscommunication of messages.
Miscommunications can lead to disagreements and frustration, especially when working with others.
Getting our message across is something everyone struggles with. To avoid confusing each other, we have to consider how our message could be interpreted.
Chapter 2: State your Intent | Page 38
Who matters?
The meaning we intend to communicate doesn’t matter if it makes no sense, or the wrong sense, to the people we want to reach.
We need to consider our intended users. Sometimes they’re our customers or the public. Often times, they’re also stakeholders, colleagues, employees, partners, superiors, or clients. These are the people who use our process.
To determine who matters, ask these questions:
Chapter 2: State your Intent | Page 41
How varies widely.
The saying “there are many ways to skin a cat” reminds us that we have options when it comes to achieving our intent. There are many ways to do just about anything
Whether you’re working on a museum exhibit, a news article, or a grocery store, you should explore all of your options before choosing a direction.
How is an ever-growing list of directions we could take while staying true to our reasons why.
To look at your options, ask yourself:
Chapter 2: State your Intent | Page 43
Why, what, and how are deeply interrelated.
Our why, what, and how aren’t always determined in a linear process. The answers to these fundamental questions may change from moment to moment.
Your why may be “because you want this checked off your to-do list” or “because you want to play with certain materials or ideas.”
Your resulting what might be to “start making the first thing that comes to mind.”
They may not be lofty in intent, but the intent has been stated. These are valid answers to why and what that will serve as a guide for how you define what is good. Your actions will be the result of your answers.
How long would you spend on a task without understanding why it’s important or what you are actually accomplishing? Constantly answering these basic questions are a big part of our everyday life.
Chapter 2: State your Intent | Page 44
Language is the material of intent.
The words we choose change the things we make and how we think about them. Our words also change how other people make sense of our work.
In writing this book, my intent was to make it:
- Accessible
- Beginner-friendly
- Useful in a broad range of situations
As a result, I had to be comfortable with it not being these other things:
- Academic
- Expert-friendly
- Useful in specific situations
Chapter 2: State your Intent | Page 45
Meet Karen.
Karen is a product manager at a startup. Her CEO thinks the key to launching their product in a crowded market is a sleek look and feel.
Karen recently conducted research to test the product with its intended users. With the results in hand, she worries that what the CEO sees as sleek is likely to seem cold to the users they want to reach.
Karen has research on her side, but she still needs to define what good means for her organization. Her team needs to state their intent.
To establish an intent, Karen talks with her CEO about how their users’ aesthetic wants don’t line up with the look and feel of the current product.
She starts their conversation by confirming that the users from her research are part of the intended audience for the product.
Next, she helps the CEO create a list of questions and actions the research brought up.
Afterwards, Karen develops a plan for communicating her findings to the rest of the team.
Chapter 3: Face Reality | Page 52
Reality involves many factors.
No matter what you’re making, you probably need to consider several of these factors:
- Time: “I only have _____________________.”
- Resources: “I have _____________________.”
- Skillset: “I know how to ________________ , but I don’t know how to ______________ yet.”
- Environment: “I’m working in a ___________.”
- Personality: “I want this work to say _________ about me.”
- Politics: “Others want this work to say _________________ about ____________.”
- Ethics: “I want this work to do right by the world by __________________.”
- Integrity: “I want to be proud of the results of my work, which means _____________.”
Chapter 3: Face Reality | Page 53
Reality happens across channels and contexts.
A channel transmits information. A commercial on TV and YouTube is accessible on two channels. A similar message could show up in your email inbox, on a billboard, on the radio, or in the mail.
We live our lives across channels.
It’s common to see someone using a smartphone while sitting in front of a computer screen, or reading a magazine while watching TV.
As users, our context is the situation we’re in, including where we are, what we’re trying to do, how we’re feeling, and anything else that shapes our experience. Our context is always unique to us and can’t be relied upon to hold steady.
If I’m tweeting about a TV show while watching it, my context is “sitting on my couch, excited enough about what I’m watching to share my reactions.”
In this context, I’m using several different channels: Twitter, a smartphone, and TV.
Chapter 3: Face Reality | Page 54
Reality has many intersections.
Tweeting while watching TV is an example of two channels working together to support a single context.
A single channel can also support multiple contexts.
For example, a website may serve someone browsing on a phone from their couch, on a tablet at a coffee shop, or on a desktop computer in a cubicle.
When you begin to unravel a mess, it’s easy to be overwhelmed by the amount of things that need to come together to support even the simplest of contexts gracefully on a single channel.
“It’s just a ____________” is an easy trap to fall into. But to make sense of real-world problems, you need to understand how users, channels, and context relate to each other.
What channels do your users prefer? What context are they likely in when encountering what you’re making? How are they feeling? Are they in a hurry? Are they on slow Wi-Fi? Are they there for entertainment or to accomplish a task?
Considering these small details will make a huge difference for you and your users.
Chapter 3: Face Reality | Page 60
Timescale matters.
While you’re thinking about scope and scale, consider the timescale you’re working with.
A timescale is a period of time your map or diagram represents. There are three main timescales:
- Then: How did things used to be?
- Now: How are things today?
- When: How do you see it being in the future?
It’s often easier to think about how things were then or how they are now before proposing changes.
As an example, if we wanted to make sense of changes to the American healthcare system over the last year, we could diagram at each of the three timescales:
Chapter 3: Face Reality | Page 63
Architecture before design.
You can tell complex stories in a diagram with boxes and arrows. A box represents a thing; an arrow represents a relationship between things.
These relationships can be one-way (e.g., dropping a package into a mailbox) or two-way (e.g., calling the postal service to see if it was delivered).
We use a diamond shape to represent a decision point. This allows us to diagram relationships that change depending on the circumstances.
When you’re making a diagram, keep the structure pliable. Give yourself room to play with the boxes, move them around, and see what happens.
Start by creating a box for each concept, each piece of content, and each process. Arrange the boxes based on how they relate to each other. Play. See what reveals itself as you move things around. Try a few different arrangements before you add the arrows.
Keep it simple. The more you add styling and polish, the less you’ll feel comfortable changing and collaborating on the diagram.
Chapter 3: Face Reality | Page 64
Keep it tidy.
If people judge books by their covers, they judge diagrams by their tidiness.
People use aesthetic cues to determine how legitimate, trustworthy, and useful information is. Your job is to produce a tidy representation of what you’re trying to convey without designing it too much or polishing it too early in the process.
As you make your diagram, keep your stakeholders in mind. Will they understand it? Will anything distract them? Crooked lines, misspellings, and styling mistakes lead people astray. Be careful not to add another layer of confusion to the mess.
Make it easy to make changes so you can take in feedback quickly and keep the conversation going, rather than defending or explaining the diagram.
Your diagram ultimately needs to be tidy enough for stakeholders to understand and comment on it, while being flexible enough to update.
Chapter 3: Face Reality | Page 66
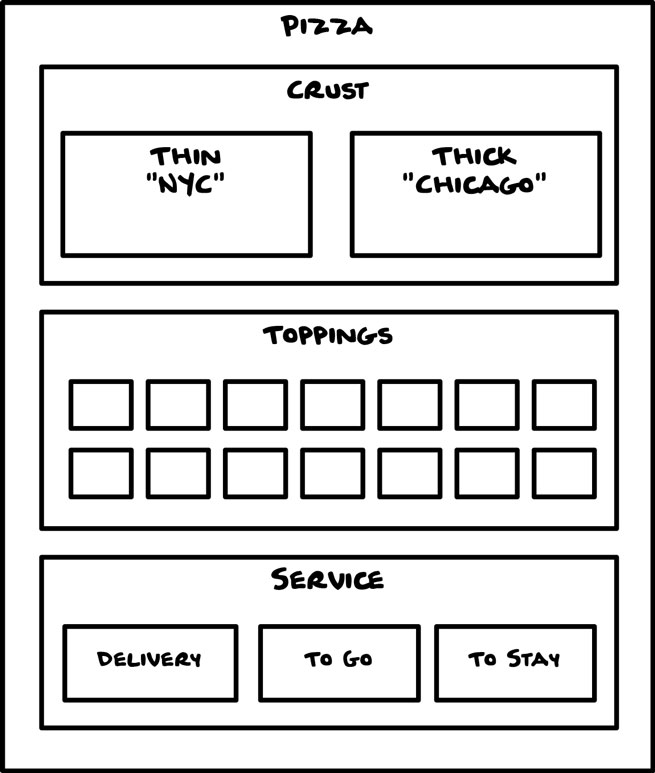
1. Block Diagram
A block diagram depicts how objects and their attributes interrelate to create a concept.
A concept is an abstract idea or general notion that exists in people’s mental models. For example, pizza is a concept on which many actual pies are fired.
Chapter 3: Face Reality | Page 68
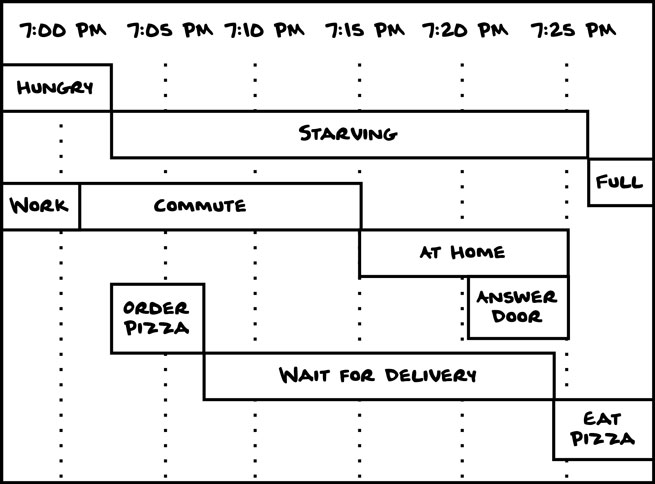
3. Gantt Chart
A Gantt chart depicts how processes relate to one another over time. Timelines, and project plans are both common examples of Gantt charts.
This type of chart helps us to understand relationships between people, tasks, and time.
Chapter 3: Face Reality | Page 69
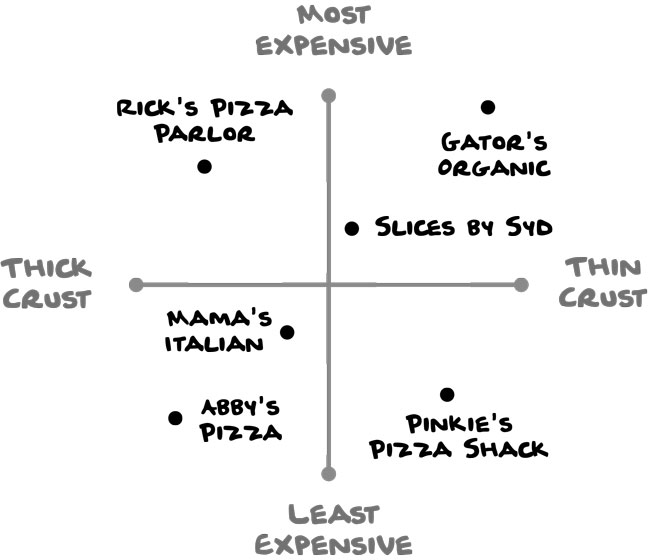
4. Quadrant Diagram
A quadrant diagram illustrates how things compare to one another. You can create one based on exact data (e.g., price of a slice, thickness of pizza-crust) or ambiguous data (e.g., fancy or casual, quality of service, or tastiness).
This diagram would be more exact with prices and crust measurements. (But how do you properly measure the thickness of pizza crust anyways?)
Chapter 3: Face Reality | Page 70
5. Venn Diagram
A Venn diagram is useful for highlighting overlapping concepts or objects. The overlap, known to some as the hedgehog or the nut, represents how these things relate. In this example, both pizza and movie relate to Friday night at home.
This same technique can be used to sort things into sets based on how they’re similar. For example, we might make a circle for movies we love and one for movies referencing pizza, and put the movies we love that reference pizza in the overlap.

Chapter 3: Face Reality | Page 71
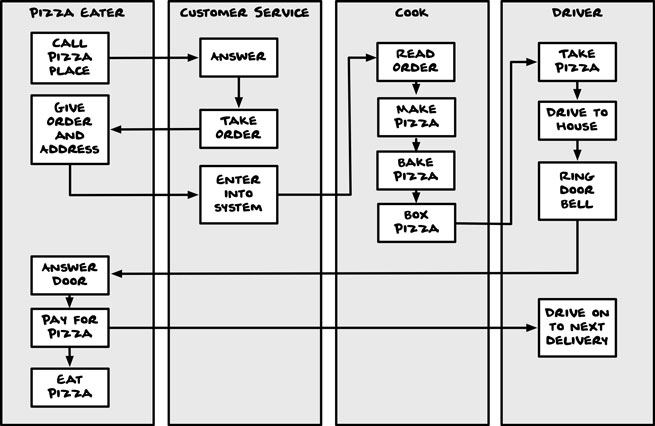
6. Swim Lane Diagram
A swim lane diagram depicts how multiple players work together to complete a task or interact within a process. The result is a list of tasks for each user. This is especially useful when you’re trying to understand how different teams or people work together.
Chapter 3: Face Reality | Page 72
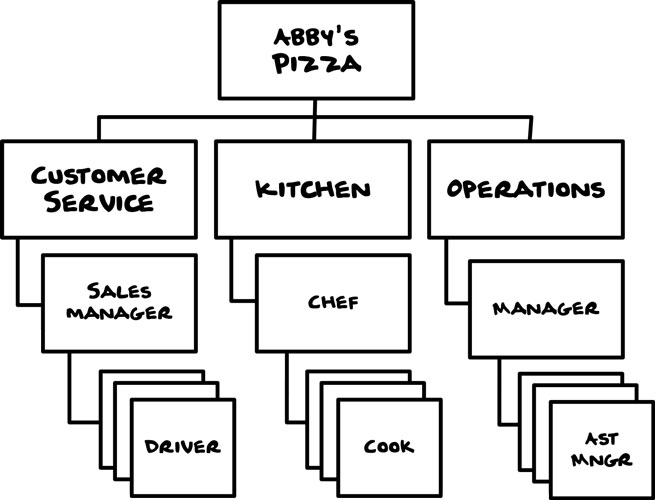
7. Hierarchy Diagram
A hierarchy diagram depicts how objects, concepts, people, and places relate to each other. In website design, hierarchy diagrams are often called sitemaps.
L-brackets, as seen below, tend to be easiest to read, but you may also see hierarchical relationships depicted as trees or pyramids.

Chapter 3: Face Reality | Page 74
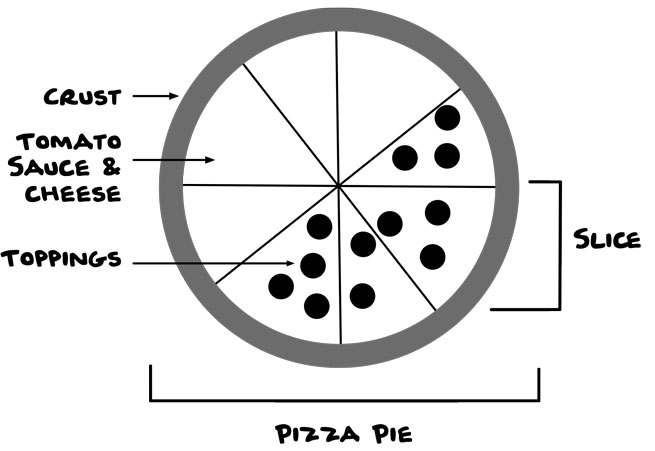
9. Schematic
A schematic is a diagram of an object or interface simplified for the sake of clarity. Schematics are known by many other names including wireframes, sketches, lo-fis, and blueprints.
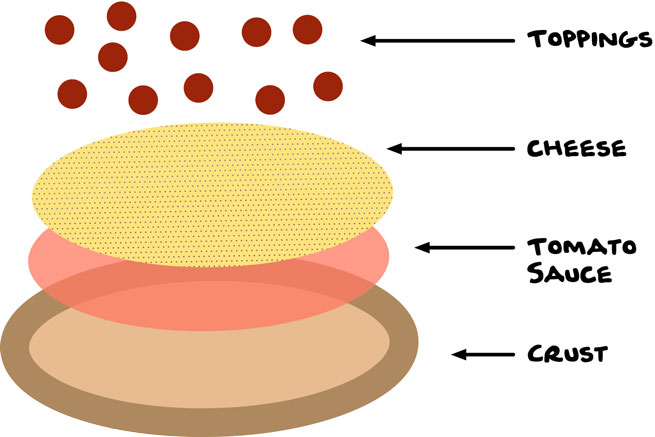
Since a schematic reduces complexity, unintended errors and ambiguity can be introduced. Would someone understand from the previous schematic to put cheese on top of the tomato sauce? Maybe not.
This is a case where an exploded schematic is useful, because it shows how the individual pieces come together to form the whole.
Chapter 3: Face Reality | Page 76
Try diagramming.
- Make a block diagram that shows how the pieces of a concept interrelate.
- Demystify a process by making a flow diagram.
- Break your latest project down into its individual tasks and make a Gantt chart.
- Compare a group of restaurants in your neighborhood in a quadrant diagram.
- Explore what happens when concepts or objects overlap using a Venn diagram.
- Break any multi-user process into a list of tasks per user with a swim lane diagram.
- Depict the content and organization of your favorite website in a hierarchy diagram.
- Unload all of the cool ideas in your mind right now in a mind map.
- Explain how to make your favorite food with a simple schematic. Bonus point for exploding it!
- Make a journey map of a day in your life.
Chapter 4: Choose a Direction | Page 100
Watch out for options and opinions.
When we talk about what something has to do, we sometimes answer with options of what it could do or opinions of what it should do.
A strong requirement describes the results you want without outlining how to get there.
A weak requirement might be written as: “A user is able to easily publish an article with one click of a button.” This simple sentence implies the interaction (one click), the interface (a button), and introduces an ambiguous measurement of quality (easily).
When we introduce implications and ambiguity into the process, we can unknowingly lock ourselves into decisions we don’t mean to make.
As an example, I once had a client ask for a “homepage made of buttons, not just text.” He had no idea that, to a web designer, a button is the way a user submits a form online. To my client, the word button meant he could change the content over time as his business changes.
Chapter 4: Choose a Direction | Page 101
Opinions are like…
No matter how hard we try to be aware of opinions swirling around us, it’s hard to remain neutral. But in the end, progress can’t happen without a decision.
When you’re choosing a direction, you may run into these questions:
- What if I disagree with a user need or opinion identified in my research?
- What if I disagree with the way another stakeholder sees a core concept or decision?
- What if I don’t want to do this the way others want me to?
Some people choose to hide from the realities behind these questions. But if you shield your ideas and simply follow orders, you may end up with goal-crushing (and soul-crushing) results.
We have to balance what we know with what we see and what other people say.
We listen to our users and our guts. There is no one right way. There is only your way.
Chapter 4: Choose a Direction | Page 103
Meet Rasheed.
Rasheed is a consultant helping the human resources department of a large company. They want to move their employee-training processes online.
Rasheed’s research uncovered a lot of language inconsistencies between how employees are hired and trained in various departments.
He always expects to account for departmental differences, but he fears this many similar terms for the same things will make for a sloppy system design.
Rasheed has a choice. He could document the terms as they exist and move on. Or he could take the time to find a direction that works for everyone.
He decides to group the terms by similar meanings and host a meeting with the departments to choose which terms should lead, and which ones should fall back.
During the meeting, Rasheed:
Chapter 4: Choose a Direction | Page 82
Moving from why to what.
After you face reality, it still takes a tremendous amount of work and courage to move from understanding why something needs to change to knowing what you can do about it.
There are many directions to choose from. Each has its own twists and turns.
People often get in their own way by becoming overwhelmed with choices, choosing not to choose instead. Others are limited by frustration over things they can’t change immediately or easily.
Change takes time.
Start by choosing a direction to go toward. If you take one step in that direction each day, you’ll get to the finish line in due time.
If you spend all your time thinking about how far the finish line is and fearing never getting there, you’ll make slower progress or never make it at all.
Chapter 4: Choose a Direction | Page 85
These levels deeply affect one another.
Once you know what level you’re working at, you can zoom in to the appropriate level of detail. Sometimes we need to zoom all the way in on an object. Other times it’s more important to zoom out to look at the ecosystem. Being able to zoom in and out as you work is the key to seeing how these levels affect one another.
When you’re deep in the details, it’s easy to forget your broad effect. When you’re working overhead, it’s easy to forget how your decisions affect things down on the ground. Making changes at one level without considering the affects they have on other levels can lead to friction and dissatisfaction between our users, our stakeholders, and us. One tiny change can spark a thousand disruptions.
For example, if we owned a restaurant and decided to eliminate paper napkins to be environmentally friendly, that would impact the entire restaurant, not just the table service our diners experience.
We’d need to consider other factors like where dirty napkins go, how we collect them, how often they’re picked up and cleaned, how many napkins we need on hand between cleanings, and if we should use paper napkins if something spills in the dining room.
One tiny decision leads to another, and another.
Chapter 4: Choose a Direction | Page 86
We make places.
You can turn a space into a place by arranging it so people know what to do there. This act is called placemaking. If you arrange a table and chairs in the middle of a room, meetings, meals, study, and play are all potential uses of that place. But if you add a fancy dining set and linens to the table, you’re suggesting that it’s a dining area.
In placemaking, you choreograph a sequence of steps users can take and decide how you want them to move. You can recommend steps, but they’ll move wherever and however they want. They may move the place settings aside and open a laptop for a meeting. You can prescribe the steps, but they do the dancing.
The ways you enforce your way of doing things changes how users think about the place you made and perhaps ultimately, how they think about you.
You could add a sign that says “Dining Only Please.” You could also add waitstaff wearing tuxedos and glaring dispositions. Each of these would say something about you and the place you made.
The way we choose to arrange a place changes how people interpret and use it. We encode our intent through the clues we leave for users to know what we want them to do.
Chapter 4: Choose a Direction | Page 88
Language matters.
I once had a project where the word “asset” was defined three different ways across five teams.
I once spent three days defining the word “customer”.
I once defined and documented over a hundred acronyms in the first week of a project for a large company, only to find 30 more the next week.
I wish I could say that I’m exaggerating or that any of this effort was unnecessary. Nope. Needed.
Language is complex. But language is also fundamental to understanding the direction we choose. Language is how we tell other people what we want, what we expect of them, and what we hope to accomplish together.
Without language, we can’t collaborate.
Unfortunately, it’s far too easy to declare a direction in language that doesn’t make sense to those it needs to support: users, stakeholders, or both.
When we don’t share a language with our users and our stakeholders, we have to work that much harder to communicate clearly.
Chapter 4: Choose a Direction | Page 94
Create a list of words you don’t say.
A controlled vocabulary doesn’t have to end with terms you intend to use. Go deeper by defining terms and concepts that misalign with your intent.
For the sake of clarity, you can also define:
- Terms and concepts that conflict with a user’s mental model of how things work
- Terms and concepts that have alternative meaning for users or stakeholders
- Terms and concepts that carry historical, political, or cultural baggage
- Acronyms and homographs that may confuse users or stakeholders
In my experience, a list of things you don’t say can be even more powerful than a list of things you do. I’ve been known to wear a whistle and blow it in meetings when someone uses a term from the don’t list.
Chapter 4: Choose a Direction | Page 97
Understand the past.
As you talk through your controlled vocabulary, listen for stories and images people associate with each term.
Language has history. Synonyms and alternatives abound. Myths can get in your way too, unless you’re willing to uncover them.
Gather the following about each term:
- History: How did the term come into being? How has it changed over time?
- Myths: Do people commonly misunderstand this term, its meaning, or its usage? How?
- Alternatives: What are the synonyms for the term? What accidental synonyms exist?
When it comes to language, people are slow to change and quick to argue. Documenting these details will help you make your controlled vocabulary as clear and useful as possible.
Chapter 4: Choose a Direction | Page 98
Think about nouns and verbs.
Nouns represent each of the objects, people, and places involved in a mess.
As an example, a post is a noun commonly associated with another noun, an author.
Verbs represent the actions that can be taken.
A post (n.) can be: written, shared, deleted, or read.
Verbs don’t exist without nouns. For example, an online share button implies that it will share this post.
Nouns are often created as a result of verbs. A post only exists after posting
It’s easy to adopt terms that are already in use or to be lazy in choosing our language. But when you’re deciding which words to use, it is important to consider the alternatives, perceptions, and associations around each term.
How would your work be different if “authors writing posts” was changed to “researchers authoring papers,” or “followers submitting comments?”
Chapter 5: Measure the Distance | Page 108
There’s distance between reality and your intent.
Your intent shows you what you want to become when you’re all grown up. But intent alone won’t get things done.
Breaking your intent into specific goals helps you to figure out where to invest your time and energy, and how to measure your progress along the way.
A goal is something specific that you want to do. A well-defined goal has the following elements:
Chapter 5: Measure the Distance | Page 109
Goals are our lens on the world.
Goals change what’s possible and what happens next.
Whether big or small, for today or this year, goals change how you spend time and resources.
The ways you set and measure goals affects how you define a good day or a bad day, valuable partners or the competition, productive time or a waste of time.
Goals are only reachable when you’re being realistic about the distance between reality and where you want to go. You may measure that distance in time, money, politics, talent, or technology.
Once you figure out the distance you need to travel, momentum can replace the anxiety of not knowing how to move forward.
Chapter 5: Measure the Distance | Page 111
Indicators help us measure progress.
Most things can be measured by systems or people.
Indicators tell you if you’re moving towards your intent or away from it. A business might use averages like dollars per order or call response time as indicators of how well they’re doing.
It’s not always easy to figure out how to measure things, but if you’re persistent, you can gain invaluable insights about your progress.
The good news is the work it takes to define and measure indicators is almost always worth the effort.
To find the right indicators, start with these questions:
- What can you measure in your world?
- What could you measure if things changed?
- What signs would tell you if you’re moving towards or away from your intent?
Examples of indicators follow.
Chapter 5: Measure the Distance | Page 112
Common indicators.
- Satisfaction: Are customers happy with what you’re delivering against your promises?
- Kudos: How often do people praise you for your efforts or contributions?
- Profit: How much was left over after expenses?
- Value: What would someone pay for it?
- Loyalty: How likely are your users to return?
- Traffic: How many people used, visited, or saw what you made?
- Conversion: What percentage of people acted the way you hoped they would?
- Spread: How fast is word getting around about what you’re doing?
- Perception: What do people believe about what you’re making or trying to achieve?
- Competition: Who has similar intents to yours?
- Complaints: How many users are reaching out about an aspect of your product or service?
- Backlash: What negative commentary do you receive or expect?
- Expenses: How much did you spend?
- Debt: How much do you owe?
- Lost time: How many minutes, hours, or days did you spend unnecessarily?
- Drop-off: How many people leave without taking the action you hoped they would?
- Waste: How much do you discard, measured in materials and time?
- Murk: What alternative truths or opinions exist about what you’re making or trying to achieve?
Chapter 5: Measure the Distance | Page 114
Use worksheets to mine data from people.
Once you have a list of indicators to guide you, think about where the data could come from.
A worksheet can help you capture important details that only exist in people’s heads or personal records.
You can fill out a worksheet in a meeting or distribute copies of it and collect them after people have time to answer your questions. To choose the best way to gather the data, keep these considerations in mind:
- Time: How much are you asking for, and how long might it take?
- Access: How many sources are your respondents using to find answers? Who else might they need to contact?
- Bias: Are they applying their own thoughts and preferences, or delivering data?
If your users or stakeholders need a significant amount of time, access, or thought to answer your questions, let them get back to you instead of trying to get through the worksheet together.
Chapter 5: Measure the Distance | Page 115
Baselines help us stay in touch with reality.
The first step in understanding how something is performing is to measure it as it is.
A baseline is the measurement of something before changing it. Without baselines, assumptions will likely lead us in the wrong direction.
Here are two examples:
- If a prominent department store saw quarterly profits increase by $1.5M after their Super Bowl ad, the ad may be seen as effective. But if the baseline of regular quarterly profit increase for this brand is typically $5.5M+ after a Super Bowl ad, we’d judge the ad differently.
- Imagine an elementary school is reporting test scores averaging in the C+ range for the majority of their students. This may seem unimpressive, or even worrisome, until our baseline is introduced: average test scores this time last year were a D+.
When we have a baseline, we can judge performance. Without that, we may mistake the ad as successful and the teachers as incapable.
Chapter 5: Measure the Distance | Page 116
Flags tell us if we’re headed in the right direction.
Flags are useful because they allow us to know when something important happens. We can attach a flag to most indicators.
These are all examples of flags:
- Having a loved one call when they arrive at their destination safely
- A dashboard light that reminds you to get gas in the next 50 miles
- A weekly email that shares customer service feedback with a design team
- An email alert when competitors are mentioned in the press
- A monthly report of how many users drop off at each step of an online registration process
Chapter 5: Measure the Distance | Page 117
Measurements have rhythm.
Some things are best measured moment to moment. Others are best measured over weeks, months, years, or even decades.
The right rhythm depends on your context and your intent. When you’re choosing a rhythm, think about the ways you collect data, how specific it needs to be, and how complex it is.
Consider these factors:
- Timeframe: Is this measurement most useful after one hour, one day, a season, a year, or an entire decade? What’s a better baseline: yesterday, last month, a year ago, or twenty years ago?
- Access: Is the data readily available? Or does it require help from a particular person or system?
Chapter 5: Measure the Distance | Page 118
Fuzzy is normal.
What is good for one person can be profoundly bad for another, even if their goal is roughly the same. We each live within a unique set of contradictions and experiences that shape how we see the world.
Remember that there’s no right or wrong way to do something. Words like right and wrong are subjective.
The important part is being honest about what you intend to accomplish within the complicated reality of your life. Your intent may differ from other people; you may perceive things differently.
You may be dealing with an indicator that’s surprisingly difficult to measure, a data source that’s grossly unreliable, or a perceptual baseline that’s impossible to back up with data.
But as fuzzy as your lens can seem, setting goals with incomplete data is still a good way to determine if you’re moving in the right direction.
Uncertainty comes up in almost every project. But you can only learn from those moments if you don’t give up. Stick with the tasks that help you clarify and measure the distance ahead.
Chapter 5: Measure the Distance | Page 120
Set your goals.
Think about what you’re trying to accomplish.
- Revisit what you intend to do and why. Now break it down into specific goals.
- Make a dream list of what would be measureable in an ideal world. Even if the measurement is fuzzy or hard to find, it’s useful to think about the best-case scenario.
- Remember to mine data from people.
- Measure the baseline of what you can. Once you have your dream list, narrow it down to an achievable set of measurements to gather a baseline reading of.
- Make a list of indicators to potentially measure.
- List some situations where you’d want to be notified if things change. Then, figure out how to make those flags for yourself.
Chapter 6: Play with Structure | Page 126
Taxonomy is how we arrange things.
When you set out to arrange something, how do you decide where the pieces go? Is it based on what looks right to you, what you believe goes together, or what someone told you to do? Or maybe you let gravity or the alphabet determine the order?
To effectively arrange anything, we have to choose methods for organizing and classifying content in ways that convey the intended information to our intended users.
Structural methods for organization and classification are called taxonomy.
Common examples of taxonomies include:
- The scientific classification for plants, animals, minerals, and other organisms
- The Dewey Decimal system for libraries
- Navigational tabs on a website
- Organizational charts showing management and team structures
Chapter 6: Play with Structure | Page 128
Sorting is easier than deciding how to sort.
Sorting is the act of arranging content according to established rules. The act of deciding how to sort something within a taxonomy is called classification.
If you have a large pile of things, it may take a lot of time to sort through them. But sorting isn’t the hard part. Classification is.
Think about sorting a bag of groceries into a pre-arranged pantry. Everything has a place. You’re simply following the plan. Easy, right?
Now unload that same bag into a kitchen without rules for where things go. How much longer would it take you? How much more frustrating a task would it be? How much variation would you get when the next person unloads groceries?
Sorting is easy when clear rules are in place. But without those rules, assumptions take over and things end up in places where they can be harder to find.
The most challenging part of classification is working with other people to agree on a set of rules.
Chapter 6: Play with Structure | Page 134
Humans are complex.
Tomatoes are scientifically classified as a fruit. Some people know this and some don’t. The tomato is a great example of the vast disagreements humans have with established exact classifications.
Our mental models shape our behavior and how we relate to information.
In the case of the tomato, there are clearly differences between what science classifies as a fruit and what humans consider appropriate for fruit salad.
If you owned an online grocery service, would you dare to only list tomatoes as fruit?
Sure, you could avoid the fruit or vegetable debate entirely by classifying everything as “produce,” or you could list tomatoes in “fruit” and “vegetables.”
But what if I told you that squash, olives, cucumbers, avocados, eggplant, peppers, and okra are also fruits that are commonly mistaken as vegetables?
What do we even mean when we say “fruit” or “vegetable” in casual conversations? Classification systems can be unhelpful and indistinguishable when you’re sorting things for a particular context.
Chapter 6: Play with Structure | Page 135
The way you organize things says a lot about you.
Classifying a tomato as a vegetable says something about what you know about your customers and your grocery store. You would classify things differently if you were working on a textbook for horticulture students, right?
How you choose to classify and organize things reflects your intent, but it can also reflect your worldview, culture, experience, or privilege.
Those same choices affect how people using your taxonomy understand what you share with them.
Taxonomies serve as a set of instructions for people interacting with our work.
Taxonomy is one of the strongest tools of rhetoric we have. The key to strong rhetoric is using language, rules and structures that your audience can easily understand and use.
Chapter 6: Play with Structure | Page 139
Taxonomies can be sequential.
Sequence is the order in which something is experienced. Some sequences happen in a logical order, where the steps are outlined ahead of time.
Other sequences are more complex with alternative paths and variations based on the circumstances, preferences, or choices of the user or the system.
These are all examples of sequences:
- A software installation wizard
- New patient sign-up forms
- A refund process at a retail store
- A job application
- A recipe
- A fiction book
- The checkout process on a website
Like any taxonomy, the categories and labels you choose affect how clear a sequence is to use.
Chapter 6: Play with Structure | Page 141
Hypertexts bridge taxonomies.
We use hypertext to connect things without necessarily placing them together.
Hypertexts are fundamentally different from hierarchical, heterarchical, and sequential taxonomies, because they don’t change where things are located, just how they’re found.
We use hyperlinks to allow users to jump between taxonomies instead of duplicating or moving content. For example, we might hyperlink the bolded words throughout this book. If a user clicks on one of them, we could take them to a definition in the lexicon. We’re moving the user to the content instead of repeating it.
A signpost directing you to a store around the corner is also hypertextual, because it sends you to a specific location without changing the location of the store.
Similarly, websites use hypertext to link to content without needing to repeat it.
Chapter 6: Play with Structure | Page 143
Meet Joan
Joan is the social media coordinator for an airline that recently merged with another airline. Overnight, her team became responsible for twice as much work as before. She’s also now responsible for managing twice as many people.
As the details of the merger iron out, duplicative channels have to be dealt with. For example, they now have two Twitter accounts and two help directories on two different websites. To tie everything together, Joan:
- Conducts user and stakeholder research
- Develops a controlled vocabulary to identify the nouns and verbs of both companies across their existing channels
- States the intent of each channel and determines the best direction to serve users
- Develops specific goals and baselines
- Identifies a set of flags to keep her informed
- Maps out the channels that she manages and how the merger will affect each over time
- Organizes each channel to better serve stakeholders and users
Chapter 7: Prepare to Adjust | Page 149
The sum is greater than its parts.
We need to understand the sum of a lot of pieces to make sense of what we have.
For example, let’s say we’re working on bringing a product to the market. To support this process, we might create:
- A hierarchical diagram of how the product is structured and labeled for users
- A flow diagram of the sequence users experience in the product
- A lexicon of terms the product will use, vetted to make sense to our audience
These are all important pieces individually, but we need to look at them together to answer questions about the whole such as:
Chapter 7: Prepare to Adjust | Page 151
Argue about discuss it until it’s clear.
It’s totally normal for fear, anxiety, and linguistic insecurity to get in the way of progress. Learning to work with others while they’re experiencing these not-so-pleasant realities is the hardest part of making sense of a mess.
Tension can lead to arguments. Arguments can cause resentment. Resentment can kill momentum. And when momentum stalls, messes grow larger and meaner.
To get through the tension, try to understand other people’s positions and perceptions:
Chapter 7: Prepare to Adjust | Page 153
We serve many masters.
No matter what the mess is made of, we have many masters, versions of reality, and needs to serve. Information is full of history and preconceptions.
Stakeholders need to:
- Know where the project is headed
- See patterns and potential outcomes
- Frame the appropriate solution for users
Users need to:
- Know how to get around
- Have a sense of what’s possible based on their needs and expectations
- Understand the intended meaning
It’s our job to uncover subjective reality.
An important part of that is identifying the differences between what stakeholders think users need and what users think they need for themselves.
Chapter 7: Prepare to Adjust | Page 155
“Hey, nice IA!” — said no one, ever.
No one comments on the plumbing or electricity of a building unless the toilet is clogged or the lights aren’t working. Then all of a sudden, pipes and wires are a hot topic of conversation.
Similarly, people don’t compliment or even critique information architecture unless it’s broken.
The “information architecture part” is almost invisible when separated from how something looks and how it’s made. For example, we can’t evaluate the quality of the structure of this eBook without considering how it was written, edited, designed, illustrated, typeset, marketed and delivered.
If you practice information architecture for the glory, get ready to be disappointed.
But if you practice it for the clarity it can bring, get ready for some seriously interesting work.
Chapter 7: Prepare to Adjust | Page 159
Meet Abby.
Abby Covert is an information architect. After ten years of practicing information architecture for clients, Abby worried that too few people knew how to practice it themselves. She decided that the best way to help would be to teach this important practice.
After two years of teaching without a textbook, Abby told her students that she intended to write the book that was missing from the world: a book about information architecture for everybody.
As she wrote the first draft, she identified a mess of inconsistencies in the language and concepts inherent in teaching an emerging practice. At the end of the semester, she had a textbook for art school students, but she didn’t have the book that she intended to write for everybody. She had gone in the wrong direction to achieve a short-term goal.
She was frustrated and fearful of starting over. But instead of giving up, Abby faced her reality and used the advice in this book to make sense of her mess.
To get to the book you are reading, she wrote over 75,000 words, defined over 100 terms as simply as she could, and tested three unique prototypes with her users.
She hopes that it makes sense.
Chapter 7: Prepare to Adjust | Page 160
Make sense yet?
- Have you explored the depth and edges of the mess that you face?
- Do you know why you have the intent you have and what it means to how you will solve your problem?
- Have you faced reality and thought about contexts and channels your users could be in?
- What language have you chosen to use to clarify your direction?
- What specific goals and baselines will you measure your progress against?
- Have you put together various structures and tested them to make sure your intended message comes through to users?
- Are you prepared to adjust?