Relationship (noun.)
Definition: A connection between things.
Also referenced as: Relationships (noun) Relate (verb)
Related to: Block Diagram, Classification, Connection, Dependency, Exploded Schematic, Flow Diagram, Gantt chart, Heterarchy, Hierarchy, Hypertext, Interpretation, Language, Map, Matrix Diagram, Mind Map, Perception, Quadrant Diagram, Sequence, Structure, Swim Lane Diagram, System, Venn Diagram, Worksheet
Chapter 2: State your Intent | Page 35
Looking good versus being good.
Pretty things can be useless, and ugly things can be useful. Beauty and quality are not always related.
When making things, we should aim to give equal attention to looking good and being good. If either side of that duality fails, the whole suffers.
As users, we may assume that a good-looking thing will also be useful and well thought-out. But it only takes a minute or two to see if our assumptions are correct. If it isn’t good, we’ll know.
As sensemakers, we may fall victim to these same assumptions about the relationships between beauty and quality of thought.
Beware of pretty things. Pretty things can lie and hide from reality. Ugly things can too.
If we’re going to sort out the messes around us, we need to ask difficult questions and go deeper than how something looks to determine if it’s good or not.
Chapter 3: Face Reality | Page 54
Reality has many intersections.
Tweeting while watching TV is an example of two channels working together to support a single context.
A single channel can also support multiple contexts.
For example, a website may serve someone browsing on a phone from their couch, on a tablet at a coffee shop, or on a desktop computer in a cubicle.
When you begin to unravel a mess, it’s easy to be overwhelmed by the amount of things that need to come together to support even the simplest of contexts gracefully on a single channel.
“It’s just a ____________” is an easy trap to fall into. But to make sense of real-world problems, you need to understand how users, channels, and context relate to each other.
What channels do your users prefer? What context are they likely in when encountering what you’re making? How are they feeling? Are they in a hurry? Are they on slow Wi-Fi? Are they there for entertainment or to accomplish a task?
Considering these small details will make a huge difference for you and your users.
Chapter 3: Face Reality | Page 63
Architecture before design.
You can tell complex stories in a diagram with boxes and arrows. A box represents a thing; an arrow represents a relationship between things.
These relationships can be one-way (e.g., dropping a package into a mailbox) or two-way (e.g., calling the postal service to see if it was delivered).
We use a diamond shape to represent a decision point. This allows us to diagram relationships that change depending on the circumstances.
When you’re making a diagram, keep the structure pliable. Give yourself room to play with the boxes, move them around, and see what happens.
Start by creating a box for each concept, each piece of content, and each process. Arrange the boxes based on how they relate to each other. Play. See what reveals itself as you move things around. Try a few different arrangements before you add the arrows.
Keep it simple. The more you add styling and polish, the less you’ll feel comfortable changing and collaborating on the diagram.
Chapter 3: Face Reality | Page 68
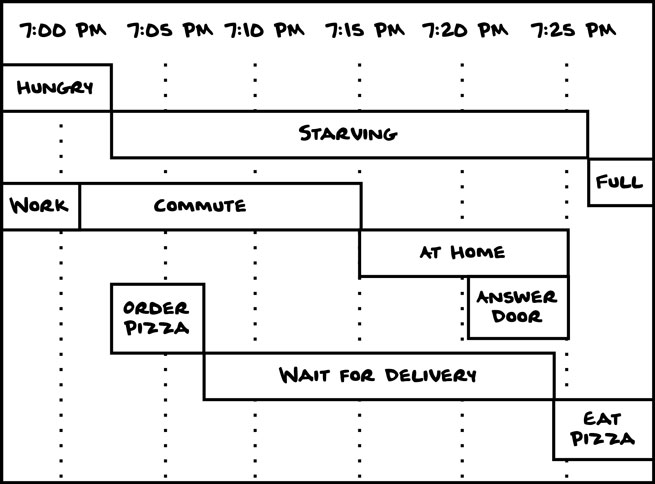
3. Gantt Chart
A Gantt chart depicts how processes relate to one another over time. Timelines, and project plans are both common examples of Gantt charts.
This type of chart helps us to understand relationships between people, tasks, and time.
Chapter 3: Face Reality | Page 70
5. Venn Diagram
A Venn diagram is useful for highlighting overlapping concepts or objects. The overlap, known to some as the hedgehog or the nut, represents how these things relate. In this example, both pizza and movie relate to Friday night at home.
This same technique can be used to sort things into sets based on how they’re similar. For example, we might make a circle for movies we love and one for movies referencing pizza, and put the movies we love that reference pizza in the overlap.

Chapter 3: Face Reality | Page 72
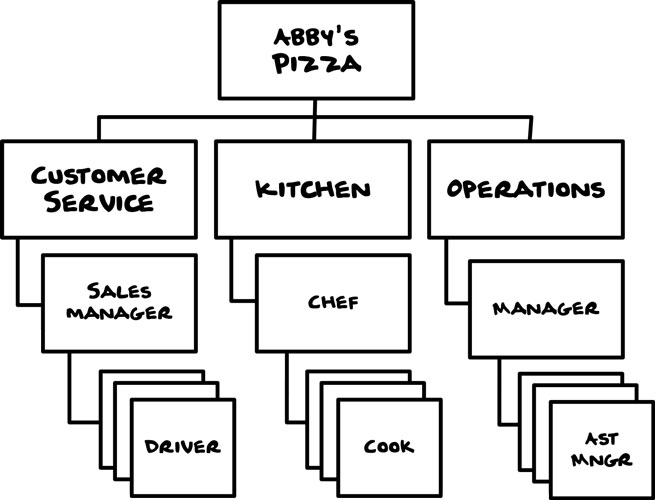
7. Hierarchy Diagram
A hierarchy diagram depicts how objects, concepts, people, and places relate to each other. In website design, hierarchy diagrams are often called sitemaps.
L-brackets, as seen below, tend to be easiest to read, but you may also see hierarchical relationships depicted as trees or pyramids.

Chapter 3: Face Reality | Page 75
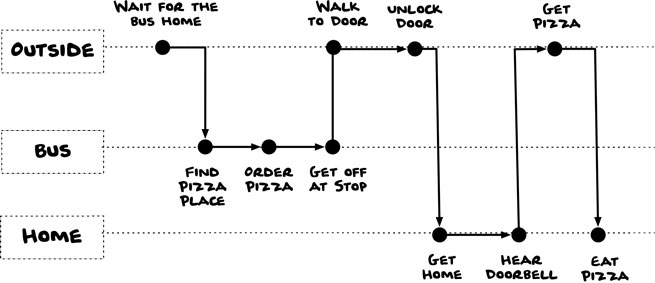
10. Journey Map
A journey map shows all of the steps and places that make up a person or group’s experience.
The rows represent the user’s context (e.g., outside, on the bus, at home). Each point represents an event or a task that makes up the overall journey. Each point is placed sequentially as it relates to the other points.
This example shows events that only involve one person, but journey maps are also useful for showing the movement of pairs, teams, and organizations.
Chapter 4: Choose a Direction | Page 102
Admit where you are.
Let’s say you’re on a weeklong bicycle trip. You planned to make it to your next stop before dark, but a flat tire delayed you by a few hours.
Even though you planned to get further along today, the truth is that pursuing that plan would be dangerous now.
Similarly, an idea you can draw on paper in one day may end up taking you a lifetime to make real. With the ability to make plans comes great responsibility.
Think about what you can do with the time and resources you have. Filtering and being realistic are part of the job. Keep reevaluating where you are in relation to where you want to go.
Be careful not to fall in love with your plans or ideas. Instead, fall in love with the effects you can have when you communicate clearly.
Chapter 4: Choose a Direction | Page 90
Understand ontology.
If we were to write a dictionary, we’d be practicing lexicography, or collecting many meanings into a list. When we decide that a word or concept holds a specific meaning in a specific context, we are practicing ontology.
Here are some examples of ontological decisions:
- Social networks redefining “like” and “friends” for their purposes
- The “folders” on a computer’s “desktop” you use to organize “files”
- The ability to order at a fast food chain by saying a number
To refine your ontology, all you need is a pile of sticky notes, a pen, and some patience.
- Find a flat or upright surface to work on.
- Write a term or concept that relates to your work on each sticky note.
- Put the sticky notes onto the surface as they relate to each other. Start to create structures and relationships based on their location.
Chapter 6: Play with Structure | Page 129
Classification can be exact or ambiguous.
Postal codes are what we call an exact classification. We can generally rely on the codes to hold steady. If the postal code is 10012, the building is in Manhattan. There’s nothing to argue about. It just is.
Ambiguous classifications require more thought to decide where something goes. The more ambiguous something is, the more it can be argued about.
Movie genres like Comedy and Drama may seem exact. But if you put three movie reviewers in a room and ask them to classify a dark comedy into one of those two genres, they may challenge each other.
Ambiguity and exactness relate to context as well.
For example, in editing this book, Nicole suggested I use the term “Postal code” instead of “Zip code” in the example above. Both would have expressed the point, but one is more exact for our context, which includes readers outside of the United States.
Chapter 6: Play with Structure | Page 134
Humans are complex.
Tomatoes are scientifically classified as a fruit. Some people know this and some don’t. The tomato is a great example of the vast disagreements humans have with established exact classifications.
Our mental models shape our behavior and how we relate to information.
In the case of the tomato, there are clearly differences between what science classifies as a fruit and what humans consider appropriate for fruit salad.
If you owned an online grocery service, would you dare to only list tomatoes as fruit?
Sure, you could avoid the fruit or vegetable debate entirely by classifying everything as “produce,” or you could list tomatoes in “fruit” and “vegetables.”
But what if I told you that squash, olives, cucumbers, avocados, eggplant, peppers, and okra are also fruits that are commonly mistaken as vegetables?
What do we even mean when we say “fruit” or “vegetable” in casual conversations? Classification systems can be unhelpful and indistinguishable when you’re sorting things for a particular context.