Quadrant Diagram (noun.)
Definition: A diagram that depicts how a group of things compare to one another according to either exact or ambiguous spectrums of classification.
Also referenced as:
Related to: Diagram, Relationship
Chapter 3: Face Reality | Page 69
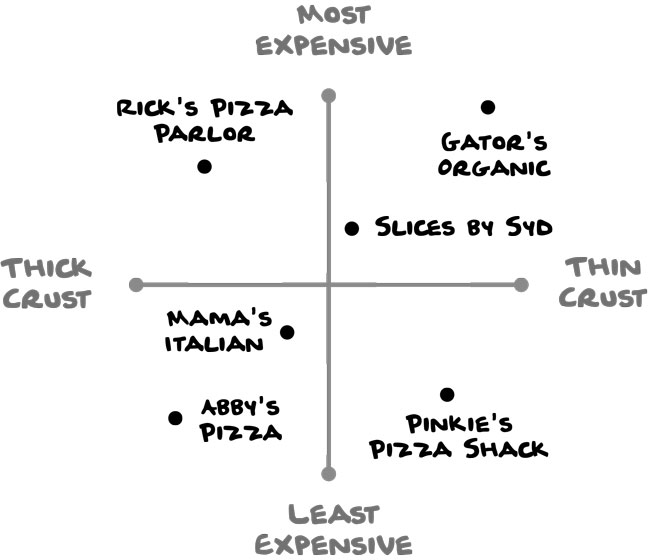
4. Quadrant Diagram
A quadrant diagram illustrates how things compare to one another. You can create one based on exact data (e.g., price of a slice, thickness of pizza-crust) or ambiguous data (e.g., fancy or casual, quality of service, or tastiness).
This diagram would be more exact with prices and crust measurements. (But how do you properly measure the thickness of pizza crust anyways?)
Chapter 3: Face Reality | Page 76
Try diagramming.
- Make a block diagram that shows how the pieces of a concept interrelate.
- Demystify a process by making a flow diagram.
- Break your latest project down into its individual tasks and make a Gantt chart.
- Compare a group of restaurants in your neighborhood in a quadrant diagram.
- Explore what happens when concepts or objects overlap using a Venn diagram.
- Break any multi-user process into a list of tasks per user with a swim lane diagram.
- Depict the content and organization of your favorite website in a hierarchy diagram.
- Unload all of the cool ideas in your mind right now in a mind map.
- Explain how to make your favorite food with a simple schematic. Bonus point for exploding it!
- Make a journey map of a day in your life.