Diagram (noun.)
Definition: Any illustration or picture that helps an audience understand something.
Also referenced as: Diagrams (noun) Diagrammatic (adjective)
Related to: Block Diagram, Chart, Edge, Exploded Schematic, Flexible, Flow Diagram, Frame, Gantt chart, Information Architect, Information Architecture, Map, Matrix Diagram, Mental Model, Mind Map, Quadrant Diagram, Scale, Schematic, Scope, Sitemap, Swim Lane Diagram, Time, Timescale, Venn Diagram, Worksheet
Chapter 1: Identify the Mess | Page 15
Things may change; the messes stay the same.
We’ve been learning how to architect information since the dawn of thought.
Page numbering, alphabetical order, indexes, lexicons, maps, and diagrams are all examples of information architecture achievements that happened well before the information age.
Even now, technology continues to change the things we make and use at a rate we don’t understand yet. But when it really comes down to it, there aren’t that many causes for confusing information.
- Too much information
- Not enough information
- Not the right information
- Some combination of these (eek!)
Chapter 3: Face Reality | Page 50
By facing reality, we can find solutions.
Whenever we’re making something, there are moments when it’s no longer time to ponder. It’s time to act, to make, to realize, and perhaps to fail.
Fear is an obvious but elusive partner in these moments. Fear can walk ahead of us and get all the glory, leaving us pondering and restless for more, more, more. Maybe we fear failure. Maybe we fear success. Maybe we fear light being shined our way.
Confronting your fears and knowing what is real is an important part of making sense of a mess.
Facing reality is the next step on our journey. In this chapter, we’ll discuss rabbit holes of reality you are likely to have to explore as well as some diagrammatic techniques you can take with you to document what you find down there.
Before we go on, I have to warn you of the many opportunities ahead to lose faith in yourself as you climb through and understand the details of your reality. It can start to feel like the mess wants you to fail in making sense of it. Don’t worry. That thought has occurred to everyone who has ever tried to change something. We all have to deal with reality. We all want what we want and then get what we get.
Chapter 3: Face Reality | Page 57
Objects let us have deeper conversations about reality.
When you discuss a specific subject, you subconsciously reference part of a large internal map of what you know.
Other people can’t see this map. It only exists in your head, and it’s called your mental model.
When faced with a problem, you reference your mental model and try to organize the aspects and complexities of what you see into recognizable patterns. Your ongoing experience changes your mental model. This book is changing it right now.
We create objects like maps, diagrams, prototypes, and lists to share what we understand and perceive. Objects allow us to compare our mental models with each other.
These objects represent our ideas, actions, and insights. When we reference objects during a conversation, we can go deeper and be more specific than verbalizing alone.
As an example, it’s much easier to teach someone about the inner-workings of a car engine with a picture, animation, diagram, or working model.
Chapter 3: Face Reality | Page 59
Start with scope and scale.
Before you make objects like diagrams or maps, spend some time determining their scope and scale.
Scope is your clearly stated purpose for the diagram. The scope of a blueprint for an actual house is greater than the scope of a diagram explaining the rooms that make up a typical house.
Scale is the relative size of your diagrammatic work.The scale of a map covering a wall is greater than the scale of a map on regular-sized paper.
Chapter 3: Face Reality | Page 60
Timescale matters.
While you’re thinking about scope and scale, consider the timescale you’re working with.
A timescale is a period of time your map or diagram represents. There are three main timescales:
- Then: How did things used to be?
- Now: How are things today?
- When: How do you see it being in the future?
It’s often easier to think about how things were then or how they are now before proposing changes.
As an example, if we wanted to make sense of changes to the American healthcare system over the last year, we could diagram at each of the three timescales:
Chapter 3: Face Reality | Page 61
Rhetoric matters.
Rhetoric is communication designed to have a persuasive effect on its audience.
Here are some common rhetorical reasons for making diagrams and maps:
- Reflection: Point to a future problem (e.g., a map of a local landfill’s size in the past, present, and projected future).
- Options: Show something as it could be (e.g., a diagram showing paths a user could take to set up an application).
- Improvements: Show something as it should be (e.g., a diagram pointing out opportunities found during user research).
- Identification: Show something as it once was or is today (e.g., a map of your neighborhood).
- Plan: Show something as it will be (e.g., a map of your neighborhood with bike lanes).
Chapter 3: Face Reality | Page 63
Architecture before design.
You can tell complex stories in a diagram with boxes and arrows. A box represents a thing; an arrow represents a relationship between things.
These relationships can be one-way (e.g., dropping a package into a mailbox) or two-way (e.g., calling the postal service to see if it was delivered).
We use a diamond shape to represent a decision point. This allows us to diagram relationships that change depending on the circumstances.
When you’re making a diagram, keep the structure pliable. Give yourself room to play with the boxes, move them around, and see what happens.
Start by creating a box for each concept, each piece of content, and each process. Arrange the boxes based on how they relate to each other. Play. See what reveals itself as you move things around. Try a few different arrangements before you add the arrows.
Keep it simple. The more you add styling and polish, the less you’ll feel comfortable changing and collaborating on the diagram.
Chapter 3: Face Reality | Page 64
Keep it tidy.
If people judge books by their covers, they judge diagrams by their tidiness.
People use aesthetic cues to determine how legitimate, trustworthy, and useful information is. Your job is to produce a tidy representation of what you’re trying to convey without designing it too much or polishing it too early in the process.
As you make your diagram, keep your stakeholders in mind. Will they understand it? Will anything distract them? Crooked lines, misspellings, and styling mistakes lead people astray. Be careful not to add another layer of confusion to the mess.
Make it easy to make changes so you can take in feedback quickly and keep the conversation going, rather than defending or explaining the diagram.
Your diagram ultimately needs to be tidy enough for stakeholders to understand and comment on it, while being flexible enough to update.
Chapter 3: Face Reality | Page 65
Expand your toolbox.
Objects like diagrams, maps, and charts aren’t one-size-fits-all. Play with them, adapt them, and expand on them for your own purposes.
The biggest mistake I see beginner sensemakers make is not expanding their toolbox of diagrammatic and mapping techniques.
There are thousands, maybe millions, of variations on the form, quality, and testing of diagrams and maps. And more are being created and experimented with each day.
The more diagrams you get to know, the more tools you have. The more ways you can frame the mess, the more likely you are to see the way through to the other side.
To help you build your toolbox, I’ve included ten diagrams and maps I use regularly in my own work.
As you review each one, imagine the parts of your mess that could benefit from reframing.
Chapter 3: Face Reality | Page 69
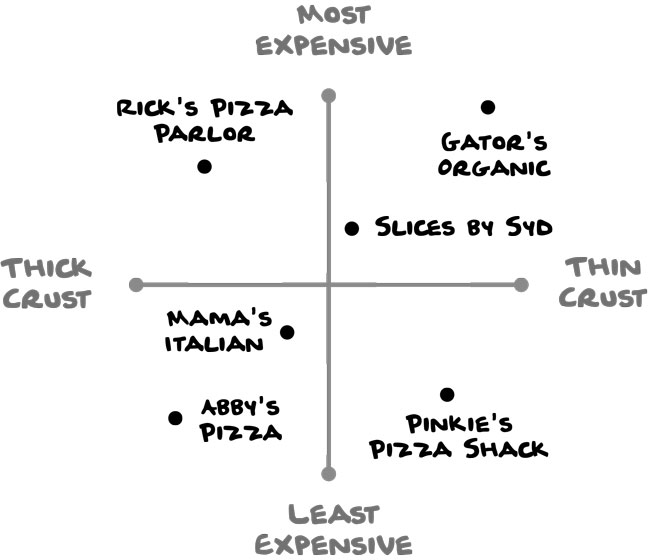
4. Quadrant Diagram
A quadrant diagram illustrates how things compare to one another. You can create one based on exact data (e.g., price of a slice, thickness of pizza-crust) or ambiguous data (e.g., fancy or casual, quality of service, or tastiness).
This diagram would be more exact with prices and crust measurements. (But how do you properly measure the thickness of pizza crust anyways?)
Chapter 3: Face Reality | Page 73
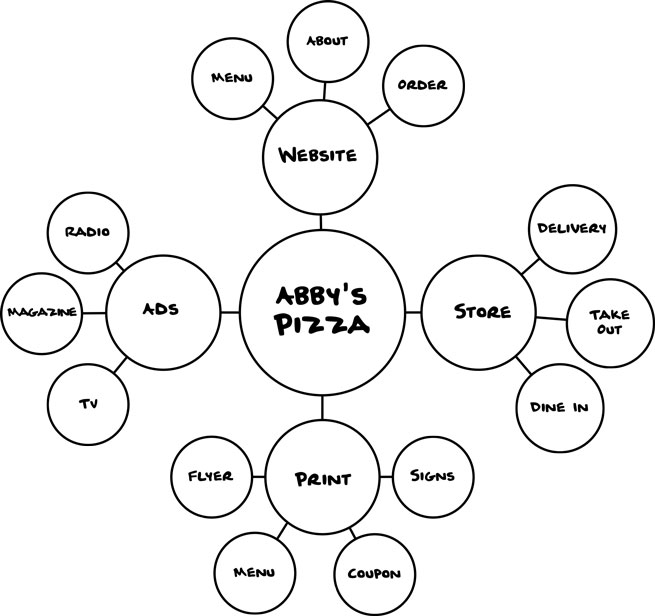
8. Mind Map
A mind map illustrates the connections between concepts, objects, ideas, channels, people, and places within a particular context.
These concepts don’t necessarily live under an established hierarchy or sequence. For example, in the diagram above, I’ve outlined the various aspects of running a pizza parlor as the owner (me!) might think about them.
Chapter 3: Face Reality | Page 74
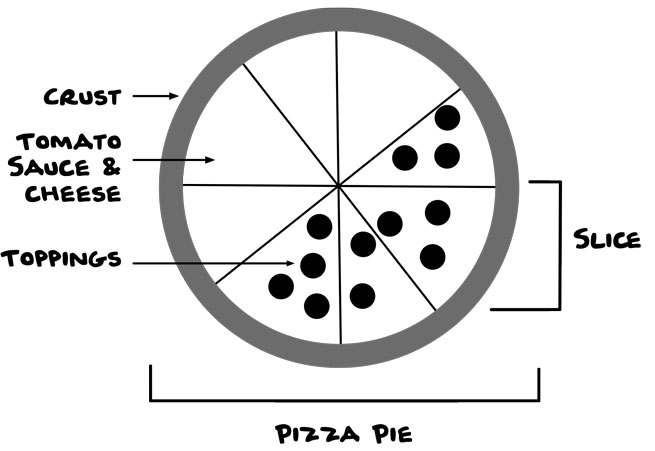
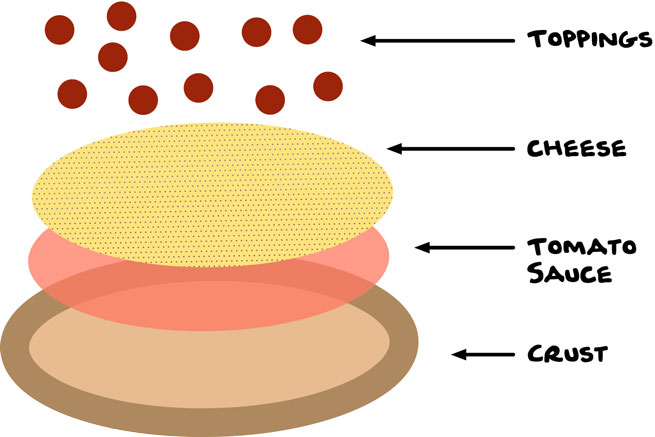
9. Schematic
A schematic is a diagram of an object or interface simplified for the sake of clarity. Schematics are known by many other names including wireframes, sketches, lo-fis, and blueprints.
Since a schematic reduces complexity, unintended errors and ambiguity can be introduced. Would someone understand from the previous schematic to put cheese on top of the tomato sauce? Maybe not.
This is a case where an exploded schematic is useful, because it shows how the individual pieces come together to form the whole.
Chapter 3: Face Reality | Page 78
Face your reality.
Everything is easier with a map. Let me guide you through making a map for your own mess.
On the following page is another favorite diagram of mine, the matrix diagram.
The power of a matrix diagram is that you can make the boxes collect whatever you want. Each box becomes a task to fulfill or a question to answer, whether you’re alone or in a group.
Matrix diagrams are especially useful when you’re facilitating a discussion, because they’re easy to create and they keep themselves on track. An empty box means you’re not done yet.
After making a simple matrix of users, contexts, players, and channels, you’ll have a guide to understanding the mess. By admitting your hopes and fears, you’re uncovering the limits you’re working within.
This matrix should also help you understand the other diagrams and objects you need to make, along with who will use and benefit from them.
Chapter 7: Prepare to Adjust | Page 149
The sum is greater than its parts.
We need to understand the sum of a lot of pieces to make sense of what we have.
For example, let’s say we’re working on bringing a product to the market. To support this process, we might create:
- A hierarchical diagram of how the product is structured and labeled for users
- A flow diagram of the sequence users experience in the product
- A lexicon of terms the product will use, vetted to make sense to our audience
These are all important pieces individually, but we need to look at them together to answer questions about the whole such as:
Chapter 7: Prepare to Adjust | Page 150
It’s easy to reach agreement alone.
Maybe you’re working on a project independently and you’re the only stakeholder and user.
More likely, you’re working with other people to serve other people. In that scenario, making maps and diagrams alone at your desk is not practicing information architecture.
Your whole team should be able to influence and react to your tools and methods. You should be making prototypes to get feedback from users on language and structure.
Getting everyone involved early is crucial. Every step you take should come from the direction you choose together. If you don’t get agreement up front, prepare for more work later.
When you see the world through the eyes of other people, you can spot weaknesses and opportunities for improvement. Don’t hide from other stakeholders or wait until the end of the project to talk to users.