Map (noun.)
Definition: A diagram that shows how places are arranged within a defined area.
Also referenced as: Maps (noun) Mapping (verb)
Related to: Chart, Diagram, Edge, Frame, Location, Relationship, Scale, Schematic, Scope, Sitemap, Time, Timescale
Chapter 1: Identify the Mess | Page 15
Things may change; the messes stay the same.
We’ve been learning how to architect information since the dawn of thought.
Page numbering, alphabetical order, indexes, lexicons, maps, and diagrams are all examples of information architecture achievements that happened well before the information age.
Even now, technology continues to change the things we make and use at a rate we don’t understand yet. But when it really comes down to it, there aren’t that many causes for confusing information.
- Too much information
- Not enough information
- Not the right information
- Some combination of these (eek!)
Chapter 3: Face Reality | Page 57
Objects let us have deeper conversations about reality.
When you discuss a specific subject, you subconsciously reference part of a large internal map of what you know.
Other people can’t see this map. It only exists in your head, and it’s called your mental model.
When faced with a problem, you reference your mental model and try to organize the aspects and complexities of what you see into recognizable patterns. Your ongoing experience changes your mental model. This book is changing it right now.
We create objects like maps, diagrams, prototypes, and lists to share what we understand and perceive. Objects allow us to compare our mental models with each other.
These objects represent our ideas, actions, and insights. When we reference objects during a conversation, we can go deeper and be more specific than verbalizing alone.
As an example, it’s much easier to teach someone about the inner-workings of a car engine with a picture, animation, diagram, or working model.
Chapter 3: Face Reality | Page 59
Start with scope and scale.
Before you make objects like diagrams or maps, spend some time determining their scope and scale.
Scope is your clearly stated purpose for the diagram. The scope of a blueprint for an actual house is greater than the scope of a diagram explaining the rooms that make up a typical house.
Scale is the relative size of your diagrammatic work.The scale of a map covering a wall is greater than the scale of a map on regular-sized paper.
Chapter 3: Face Reality | Page 60
Timescale matters.
While you’re thinking about scope and scale, consider the timescale you’re working with.
A timescale is a period of time your map or diagram represents. There are three main timescales:
- Then: How did things used to be?
- Now: How are things today?
- When: How do you see it being in the future?
It’s often easier to think about how things were then or how they are now before proposing changes.
As an example, if we wanted to make sense of changes to the American healthcare system over the last year, we could diagram at each of the three timescales:
Chapter 3: Face Reality | Page 61
Rhetoric matters.
Rhetoric is communication designed to have a persuasive effect on its audience.
Here are some common rhetorical reasons for making diagrams and maps:
- Reflection: Point to a future problem (e.g., a map of a local landfill’s size in the past, present, and projected future).
- Options: Show something as it could be (e.g., a diagram showing paths a user could take to set up an application).
- Improvements: Show something as it should be (e.g., a diagram pointing out opportunities found during user research).
- Identification: Show something as it once was or is today (e.g., a map of your neighborhood).
- Plan: Show something as it will be (e.g., a map of your neighborhood with bike lanes).
Chapter 3: Face Reality | Page 65
Expand your toolbox.
Objects like diagrams, maps, and charts aren’t one-size-fits-all. Play with them, adapt them, and expand on them for your own purposes.
The biggest mistake I see beginner sensemakers make is not expanding their toolbox of diagrammatic and mapping techniques.
There are thousands, maybe millions, of variations on the form, quality, and testing of diagrams and maps. And more are being created and experimented with each day.
The more diagrams you get to know, the more tools you have. The more ways you can frame the mess, the more likely you are to see the way through to the other side.
To help you build your toolbox, I’ve included ten diagrams and maps I use regularly in my own work.
As you review each one, imagine the parts of your mess that could benefit from reframing.
Chapter 3: Face Reality | Page 78
Face your reality.
Everything is easier with a map. Let me guide you through making a map for your own mess.
On the following page is another favorite diagram of mine, the matrix diagram.
The power of a matrix diagram is that you can make the boxes collect whatever you want. Each box becomes a task to fulfill or a question to answer, whether you’re alone or in a group.
Matrix diagrams are especially useful when you’re facilitating a discussion, because they’re easy to create and they keep themselves on track. An empty box means you’re not done yet.
After making a simple matrix of users, contexts, players, and channels, you’ll have a guide to understanding the mess. By admitting your hopes and fears, you’re uncovering the limits you’re working within.
This matrix should also help you understand the other diagrams and objects you need to make, along with who will use and benefit from them.
Chapter 4: Choose a Direction | Page 91
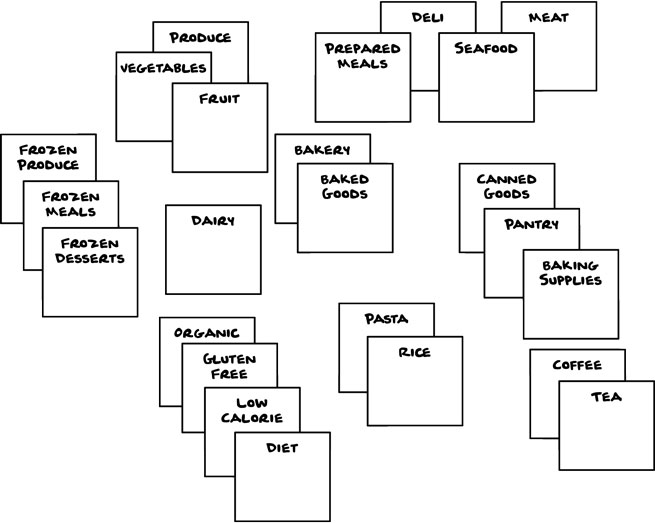
Your ontology already exists.
Ontology always exists, but the one you have today may be messy or nonsensical. If you were trying to understand the ontology of your grocery store, your map might look like this at first:
By asking your customers for words they think about within a grocery store, your map could grow to reflect overlapping and related terms.
If you were choosing words for the aisle and department signs or the website, this exercise would help you along.
Chapter 6: Play with Structure | Page 143
Meet Joan
Joan is the social media coordinator for an airline that recently merged with another airline. Overnight, her team became responsible for twice as much work as before. She’s also now responsible for managing twice as many people.
As the details of the merger iron out, duplicative channels have to be dealt with. For example, they now have two Twitter accounts and two help directories on two different websites. To tie everything together, Joan:
- Conducts user and stakeholder research
- Develops a controlled vocabulary to identify the nouns and verbs of both companies across their existing channels
- States the intent of each channel and determines the best direction to serve users
- Develops specific goals and baselines
- Identifies a set of flags to keep her informed
- Maps out the channels that she manages and how the merger will affect each over time
- Organizes each channel to better serve stakeholders and users
Chapter 7: Prepare to Adjust | Page 150
It’s easy to reach agreement alone.
Maybe you’re working on a project independently and you’re the only stakeholder and user.
More likely, you’re working with other people to serve other people. In that scenario, making maps and diagrams alone at your desk is not practicing information architecture.
Your whole team should be able to influence and react to your tools and methods. You should be making prototypes to get feedback from users on language and structure.
Getting everyone involved early is crucial. Every step you take should come from the direction you choose together. If you don’t get agreement up front, prepare for more work later.
When you see the world through the eyes of other people, you can spot weaknesses and opportunities for improvement. Don’t hide from other stakeholders or wait until the end of the project to talk to users.