System (noun.)
Definition: A set of structures.
Also referenced as: Systems (noun)
Related to: Ecosystem, Edge, Experience, Interact, Journey, Level, Mess, Prototype, Relationship, Requirement, Schematic, Sequence, User
Chapter 1: Identify the Mess | Page 13
Information architecture is all around you.
Information architecture is the way that we arrange the parts of something to make it understandable.
Here are some examples of Information architecture:
- Alphabetical cross-referencing systems used in a dictionary or encyclopedia
- Links in website navigation
- Sections, labels, and names of things on a restaurant menu
- Categories, labels and tasks used in a software program or application
- The signs that direct travelers in an airport
We rely on Information architecture to help us make sense of the world around us.
Chapter 1: Identify the Mess | Page 17
Every thing is complex.
Some things are simple. Some things are complicated. Every single thing in the universe is complex.
Complexity is part of the equation. We don’t get to choose our way out of it.
Here are three complexities you may encounter:
- A common complexity is lacking a clear direction or agreeing on how to approach something you are working on with others.
- It can be complex to create, change, access, and maintain useful connections between people and systems, but these connections make it possible for us to communicate.
- People perceive what’s going on around them in different ways. Differing interpretations can make a mess complex to work through.
Chapter 2: State your Intent | Page 33
What is good?
Language is any system of communication that exists to establish shared meaning. Even within a single language, one term can mean something in situation A and something different in situation B. We call this a homograph. For example, the word pool can mean a swimming pool, shooting pool, or a betting pool.
Perception is the process of considering, and interpreting something. Perception is subjective like truth is. Something that’s beautiful to one person may be an eyesore to another. For example, many designers would describe the busy, colorful patterns in the carpets of Las Vegas as gaudy. People who frequent casinos often describe them as beautiful.
However good or bad these carpet choices seem to us, there are reasons why they look that way. Las Vegas carpets are busy and colorful to disguise spills and wear and tear from foot traffic. Gamblers likely enjoy how they look because of an association with an activity that they enjoy. For Las Vegas casino owners and their customers, those carpet designs are good. For designers, they’re bad. Neither side is right. Both sides have an opinion.
What we intend to do determines how we define words like good and bad.
Chapter 3: Face Reality | Page 55
Reality doesn’t always fit existing patterns.
Beware of jumping into an existing solution or copying existing patterns. In my experience, too many people buy into an existing solution’s flexibility to later discover its rigidity.
Imagine trying to design a luxury fashion magazine using a technical system for grocery store coupons. The features you need may seem similar enough until you consider your context. That’s when reality sets in.
What brings whopping returns to one business might crush another. What works for kids might annoy older people. What worked five years ago may not work today.
We have to think about the effects of adopting an existing structure or language before doing so.
When architecting information, focus on your own unique objectives. You can learn from and borrow from other people. But it’s best to look at their decisions through the lens of your intended outcome.
Chapter 3: Face Reality | Page 60
Timescale matters.
While you’re thinking about scope and scale, consider the timescale you’re working with.
A timescale is a period of time your map or diagram represents. There are three main timescales:
- Then: How did things used to be?
- Now: How are things today?
- When: How do you see it being in the future?
It’s often easier to think about how things were then or how they are now before proposing changes.
As an example, if we wanted to make sense of changes to the American healthcare system over the last year, we could diagram at each of the three timescales:
Chapter 3: Face Reality | Page 67
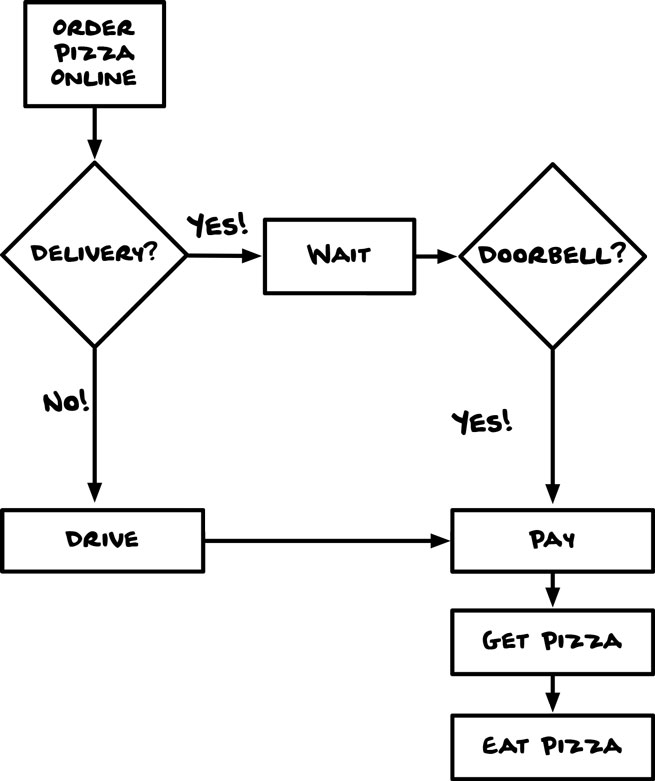
2. Flow Diagram
A flow diagram outlines the steps in a process, including conditions a user or system is under, and connections between tasks.
Conditions are rules that dictate the flow. For example, the path I take in the flow is different if I’m ordering for pickup or delivery.
Chapter 4: Choose a Direction | Page 103
Meet Rasheed.
Rasheed is a consultant helping the human resources department of a large company. They want to move their employee-training processes online.
Rasheed’s research uncovered a lot of language inconsistencies between how employees are hired and trained in various departments.
He always expects to account for departmental differences, but he fears this many similar terms for the same things will make for a sloppy system design.
Rasheed has a choice. He could document the terms as they exist and move on. Or he could take the time to find a direction that works for everyone.
He decides to group the terms by similar meanings and host a meeting with the departments to choose which terms should lead, and which ones should fall back.
During the meeting, Rasheed:
Chapter 4: Choose a Direction | Page 84
What are you making?
Nothing exists in a vacuum. Everything connects to a larger whole. Whenever you’re making something, figure out which levels you’re working at:
Interface: a point where a user affects that thing.
Location: a particular place or position.
Journey: the steps in or between locations.
Structure: a configuration of objects and locations.
System: a set of structures working together.
Chapter 5: Measure the Distance | Page 111
Indicators help us measure progress.
Most things can be measured by systems or people.
Indicators tell you if you’re moving towards your intent or away from it. A business might use averages like dollars per order or call response time as indicators of how well they’re doing.
It’s not always easy to figure out how to measure things, but if you’re persistent, you can gain invaluable insights about your progress.
The good news is the work it takes to define and measure indicators is almost always worth the effort.
To find the right indicators, start with these questions:
- What can you measure in your world?
- What could you measure if things changed?
- What signs would tell you if you’re moving towards or away from your intent?
Examples of indicators follow.
Chapter 5: Measure the Distance | Page 117
Measurements have rhythm.
Some things are best measured moment to moment. Others are best measured over weeks, months, years, or even decades.
The right rhythm depends on your context and your intent. When you’re choosing a rhythm, think about the ways you collect data, how specific it needs to be, and how complex it is.
Consider these factors:
- Timeframe: Is this measurement most useful after one hour, one day, a season, a year, or an entire decade? What’s a better baseline: yesterday, last month, a year ago, or twenty years ago?
- Access: Is the data readily available? Or does it require help from a particular person or system?
Chapter 6: Play with Structure | Page 126
Taxonomy is how we arrange things.
When you set out to arrange something, how do you decide where the pieces go? Is it based on what looks right to you, what you believe goes together, or what someone told you to do? Or maybe you let gravity or the alphabet determine the order?
To effectively arrange anything, we have to choose methods for organizing and classifying content in ways that convey the intended information to our intended users.
Structural methods for organization and classification are called taxonomy.
Common examples of taxonomies include:
- The scientific classification for plants, animals, minerals, and other organisms
- The Dewey Decimal system for libraries
- Navigational tabs on a website
- Organizational charts showing management and team structures
Chapter 6: Play with Structure | Page 127
We combine taxonomies to create unique forms.
Taxonomies shape our experience at every level. We use taxonomies to make sense of everything from systems to objects. It often takes multiple taxonomic approaches to make sense of a single form.
A Form is the visual shape or configuration something takes. The form is what users actually experience.
Even a simple form like this book uses several taxonomies to help you read through the content, understand it, and use it.
A few taxonomies in this book:
- Table of contents
- Chapter sequence
- Page numbers
- Headlines that accompany brief expansions on an individual lesson
- An Indexed lexicon
- Links to worksheets
Chapter 6: Play with Structure | Page 134
Humans are complex.
Tomatoes are scientifically classified as a fruit. Some people know this and some don’t. The tomato is a great example of the vast disagreements humans have with established exact classifications.
Our mental models shape our behavior and how we relate to information.
In the case of the tomato, there are clearly differences between what science classifies as a fruit and what humans consider appropriate for fruit salad.
If you owned an online grocery service, would you dare to only list tomatoes as fruit?
Sure, you could avoid the fruit or vegetable debate entirely by classifying everything as “produce,” or you could list tomatoes in “fruit” and “vegetables.”
But what if I told you that squash, olives, cucumbers, avocados, eggplant, peppers, and okra are also fruits that are commonly mistaken as vegetables?
What do we even mean when we say “fruit” or “vegetable” in casual conversations? Classification systems can be unhelpful and indistinguishable when you’re sorting things for a particular context.
Chapter 6: Play with Structure | Page 139
Taxonomies can be sequential.
Sequence is the order in which something is experienced. Some sequences happen in a logical order, where the steps are outlined ahead of time.
Other sequences are more complex with alternative paths and variations based on the circumstances, preferences, or choices of the user or the system.
These are all examples of sequences:
- A software installation wizard
- New patient sign-up forms
- A refund process at a retail store
- A job application
- A recipe
- A fiction book
- The checkout process on a website
Like any taxonomy, the categories and labels you choose affect how clear a sequence is to use.
Chapter 6: Play with Structure | Page 142
Most things need a mix of taxonomic approaches.
The world is organized in seemingly endless ways, but in reality, every form can be broken down into some taxonomic patterns.
Hierarchy, heterarchy, sequence, and hypertext are just a few common patterns. Most forms involve more than one of these.
A typical website has a hierarchical navigation system, a sequence for signing up or interacting with content, and hypertext links to related content.
A typical grocery store has a hierarchical aisle system, a heterarchical database for the clerk to retrieve product information by scanning a barcode, and sequences for checking out and other basic customer service tasks. I was even in a grocery store recently where each cart had a list of the aisle locations of the 25 most common products. A great use of hypertext.
A typical book has a sequence-based narrative, a hierarchical table of contents, and a set of facets allowing it to be retrieved with either the Dewey Decimal system at a library, or within a genre-based hierarchical system used in bookstores and websites like Amazon.com.