Data (noun.)
Definition: A collection of facts, observations, and questions about something.
Also referenced as:
Related to: Access, Baseline, Channel, Chart, Communication, Content, Flag, Fuzzy, Indicator, Information, Knowledge, Measure, Mental Model, Mess, Pattern, Perception, Rhythm, Worksheet
Chapter 1: Identify the Mess | Page 21
Information is not data or content.
Data is facts, observations, and questions about something. Content can be cookies, words, documents, images, videos, or whatever you’re arranging or sequencing.
The difference between information, data, and content is tricky, but the important point is that the absence of content or data can be just as informing as the presence.
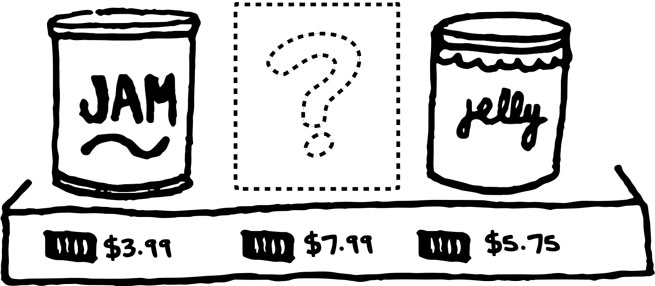
For example, if we ask two people why there is an empty spot on a grocery store shelf, one person might interpret the spot to mean that a product is sold-out, and the other might interpret it as being popular.
The jars, the jam, the price tags, and the shelf are the content. The detailed observations each person makes about these things are data. What each person encountering that shelf believes to be true about the empty spot is the information.
Chapter 1: Identify the Mess | Page 28
It’s your turn.
This chapter outlines why it’s important to identify the edges and depths of a mess, so you can lessen your anxiety and make progress.
I also introduced the need to look further than what is true, and pay attention to how users and stakeholders interpretlanguage, data, and content.
To start to identify the mess you’re facing, work through these questions:
- Users: Who are your intended users? What do you know about them? How can you get to know them better? How might they describe this mess?
- Stakeholders: Who are your stakeholders? What are their expectations? What are their thoughts about this mess? How might they describe it?
- Information: What interpretations are you dealing with? What information is being created through a lack of data or content?
- Current state: Are you dealing with too much information, not enough information, not the right information, or a combination of these?
Chapter 3: Face Reality | Page 69
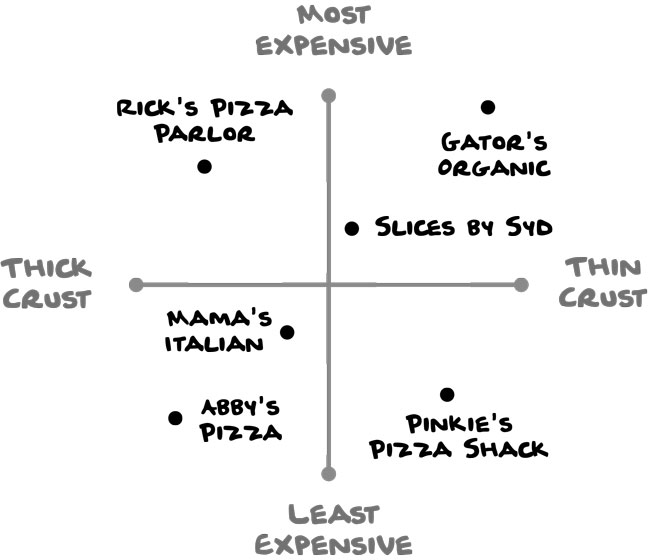
4. Quadrant Diagram
A quadrant diagram illustrates how things compare to one another. You can create one based on exact data (e.g., price of a slice, thickness of pizza-crust) or ambiguous data (e.g., fancy or casual, quality of service, or tastiness).
This diagram would be more exact with prices and crust measurements. (But how do you properly measure the thickness of pizza crust anyways?)
Chapter 5: Measure the Distance | Page 114
Use worksheets to mine data from people.
Once you have a list of indicators to guide you, think about where the data could come from.
A worksheet can help you capture important details that only exist in people’s heads or personal records.
You can fill out a worksheet in a meeting or distribute copies of it and collect them after people have time to answer your questions. To choose the best way to gather the data, keep these considerations in mind:
- Time: How much are you asking for, and how long might it take?
- Access: How many sources are your respondents using to find answers? Who else might they need to contact?
- Bias: Are they applying their own thoughts and preferences, or delivering data?
If your users or stakeholders need a significant amount of time, access, or thought to answer your questions, let them get back to you instead of trying to get through the worksheet together.
Chapter 5: Measure the Distance | Page 116
Flags tell us if we’re headed in the right direction.
Flags are useful because they allow us to know when something important happens. We can attach a flag to most indicators.
These are all examples of flags:
- Having a loved one call when they arrive at their destination safely
- A dashboard light that reminds you to get gas in the next 50 miles
- A weekly email that shares customer service feedback with a design team
- An email alert when competitors are mentioned in the press
- A monthly report of how many users drop off at each step of an online registration process
Chapter 5: Measure the Distance | Page 117
Measurements have rhythm.
Some things are best measured moment to moment. Others are best measured over weeks, months, years, or even decades.
The right rhythm depends on your context and your intent. When you’re choosing a rhythm, think about the ways you collect data, how specific it needs to be, and how complex it is.
Consider these factors:
- Timeframe: Is this measurement most useful after one hour, one day, a season, a year, or an entire decade? What’s a better baseline: yesterday, last month, a year ago, or twenty years ago?
- Access: Is the data readily available? Or does it require help from a particular person or system?
Chapter 5: Measure the Distance | Page 118
Fuzzy is normal.
What is good for one person can be profoundly bad for another, even if their goal is roughly the same. We each live within a unique set of contradictions and experiences that shape how we see the world.
Remember that there’s no right or wrong way to do something. Words like right and wrong are subjective.
The important part is being honest about what you intend to accomplish within the complicated reality of your life. Your intent may differ from other people; you may perceive things differently.
You may be dealing with an indicator that’s surprisingly difficult to measure, a data source that’s grossly unreliable, or a perceptual baseline that’s impossible to back up with data.
But as fuzzy as your lens can seem, setting goals with incomplete data is still a good way to determine if you’re moving in the right direction.
Uncertainty comes up in almost every project. But you can only learn from those moments if you don’t give up. Stick with the tasks that help you clarify and measure the distance ahead.
Chapter 5: Measure the Distance | Page 120
Set your goals.
Think about what you’re trying to accomplish.
- Revisit what you intend to do and why. Now break it down into specific goals.
- Make a dream list of what would be measureable in an ideal world. Even if the measurement is fuzzy or hard to find, it’s useful to think about the best-case scenario.
- Remember to mine data from people.
- Measure the baseline of what you can. Once you have your dream list, narrow it down to an achievable set of measurements to gather a baseline reading of.
- Make a list of indicators to potentially measure.
- List some situations where you’d want to be notified if things change. Then, figure out how to make those flags for yourself.
Chapter 6: Play with Structure | Page 132
Facets are the lenses we use to classify.
A facet is a discrete piece of knowledge you can use to classify something. The more facets something has, the more ways it can be organized.
Using the record store as an example, the following facets are available for each record:
- Record Name
- Artist Name
- Record Label
- Length
- Release Date
- Price
If a particular facet is interesting but the data to support it doesn’t exist or is hard to gather, it might not be the best plan to use that facet.
For example, finding out which instrument models were used on each album may be interesting, but it is also likely to be quite time-consuming to collect.
Chapter 6: Play with Structure | Page 142
Most things need a mix of taxonomic approaches.
The world is organized in seemingly endless ways, but in reality, every form can be broken down into some taxonomic patterns.
Hierarchy, heterarchy, sequence, and hypertext are just a few common patterns. Most forms involve more than one of these.
A typical website has a hierarchical navigation system, a sequence for signing up or interacting with content, and hypertext links to related content.
A typical grocery store has a hierarchical aisle system, a heterarchical database for the clerk to retrieve product information by scanning a barcode, and sequences for checking out and other basic customer service tasks. I was even in a grocery store recently where each cart had a list of the aisle locations of the 25 most common products. A great use of hypertext.
A typical book has a sequence-based narrative, a hierarchical table of contents, and a set of facets allowing it to be retrieved with either the Dewey Decimal system at a library, or within a genre-based hierarchical system used in bookstores and websites like Amazon.com.